What We Set Out to Answer
Our Core Research Question
Study Scope Note
This study focuses on ambient (outdoor) PM₂.₅ exposure. Indoor sources of pollution, such as cooking or heating fuels, are not included. While this means our estimates don't cover the full spectrum of exposure, outdoor air pollution remains the dominant and most consistently measured source across countries, making it a reliable basis for global comparison.
What Is PM₂.₅?
PM₂.₅ consists of ultrafine particles emitted from various sources. Because of its small size, PM₂.₅ can penetrate deep into the lungs, cross into the bloodstream, and contribute to serious health conditions.
Sources of PM₂.₅
- • Vehicle exhaust
- • Industrial activity
- • Biomass burning
- • Dust and construction
- • Power plant emissions
- • Agricultural activities
Health Effects
- • Asthma and respiratory issues
- • COPD (Chronic Obstructive Pulmonary Disease)
- • Stroke and cardiovascular disease
- • Heart disease
- • Lung cancer
- • Premature death
Statistical Methods & Techniques
We applied several statistical and machine learning techniques to uncover patterns in the data, each serving a specific purpose in our analysis.
Core Statistical Techniques
Temporal Analysis
Rolling Averages
Multi-year averages to smooth out year-to-year fluctuations and capture longer-term trends.
Lagged Averages
Averages from previous years to estimate delayed health effects of pollution exposure.
Why This Matters
Health effects from air pollution often develop over years, not immediately. Our temporal analysis captures these delayed impacts.
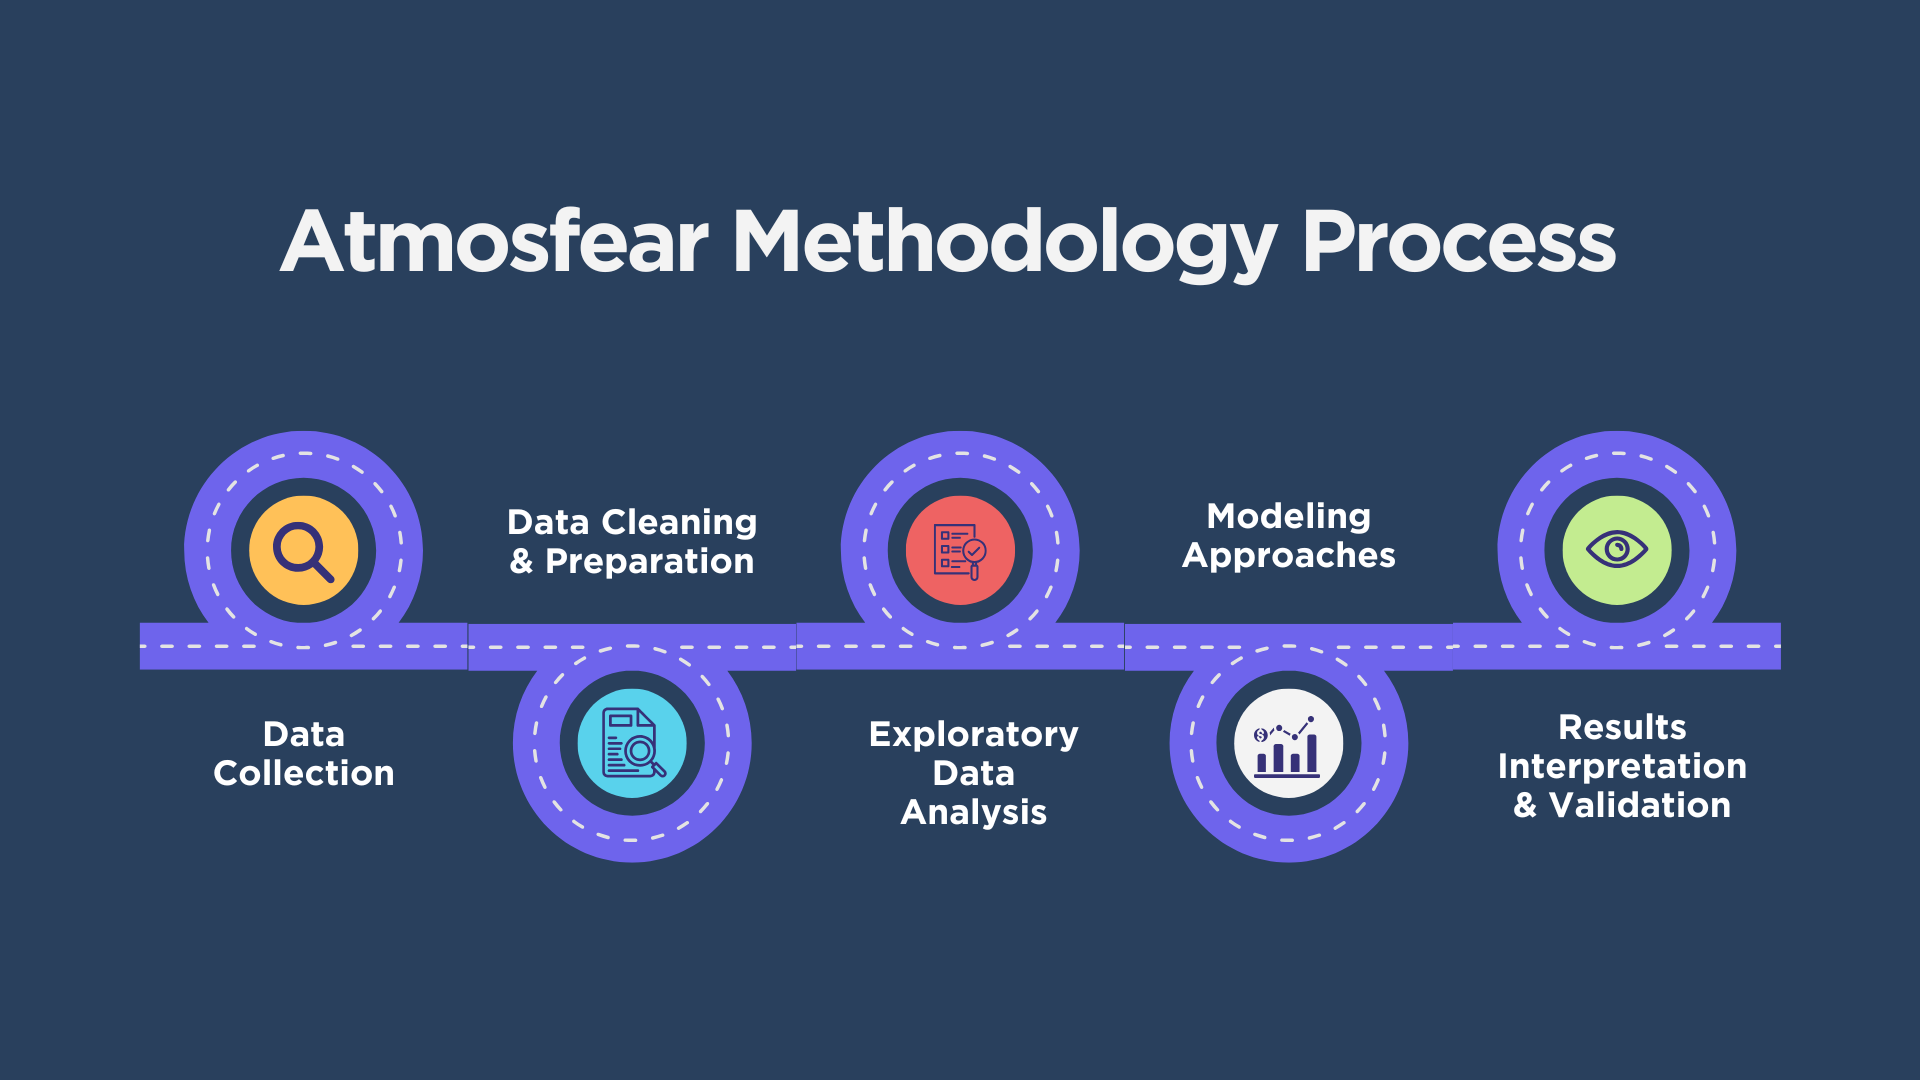
Research methodology and statistical analysis process
Key Findings
Our analysis reveals significant disparities in how air pollution affects different populations worldwide
PM₂.₅ Hits Harder in Low-SDI Countries
The same air pollution is more dangerous if you live in a less-developed country.
SDI Is the Strongest Predictor
Socio-demographic development (SDI) consistently explains the largest share of variation in DALYs across countries.
Pollution's Effects Are Cumulative
Models that used 3 to 5 year rolling averages performed better than single-year exposure.
COVID-19: Weaker but Consistent Link
Long-term PM₂.₅ exposure showed a modest but consistent association with COVID-19 mortality in 2020.
Data Sources & Measurements
What We Measured
PM₂.₅ Exposure Data
Annual averages at country level from the WHO Global Health Observatory . This includes ambient (outdoor) particulate matter concentrations measured in μg/m³.
Health Burden Data (DALYs)
Disability-Adjusted Life Years from the IHME Global Burden of Disease study . Covers cardiovascular disease, stroke, chronic respiratory disease, and all-cause mortality.
SDI (Socio-Demographic Index)
A composite measure combining income per capita, average educational attainment, and total fertility rate, from the IHME SDI database . Represents a country's development level on a 0–1 scale.
Disease Categories: We grouped our results by disease type: Cardiovascular disease, Stroke, Chronic respiratory disease, All-cause DALYs, and COVID-19 mortality
Research Visualizations
Explore our complete collection of data visualizations and analysis figures

Vulnerability Analysis by Region
How development level affects health vulnerability to air pollution

Top 10 Countries by PM₂.₅ Exposure
Countries with highest ambient air pollution levels

Respiratory DALYs Model Diagnostics
Statistical validation of respiratory disease models

Cardiovascular DALYs Model Diagnostics
Statistical validation of cardiovascular disease models
Technical Glossary
Key terms and concepts used throughout our research and analysis
| Term | Definition |
|---|---|
| PM₂.₅ | Fine particulate matter smaller than 2.5 micrometers in diameter. These airborne particles can penetrate deep into the lungs and enter the bloodstream, causing serious health effects. |
| DALYs | Disability-Adjusted Life Years - a measure of overall disease burden, calculated as the sum of years of life lost due to premature death and years lived with disability. |
| SDI | Socio-Demographic Index - a composite index combining income, education level, and fertility rate to represent a country's development level (0-1 scale). |
| Rolling Average | A multi-year average of data used to smooth out year-to-year fluctuations and capture longer-term trends in pollution exposure. |
| Lagged Average | An average of exposure values from previous years used to estimate delayed health effects of pollution (health impacts often occur years after exposure). |
| Linear Regression | A basic statistical method that models the relationship between a continuous outcome and predictors by fitting a straight line. Used as baseline to estimate average effects. |
| Random Forest Regression | A machine learning method using an ensemble of decision trees to model complex and nonlinear relationships between variables. Helps detect patterns missed by linear models. |
| Log-Transformed Regression | Linear regression where the dependent variable is log-transformed to handle skewed data and stabilize variance, particularly useful for COVID-19 mortality data. |
| Interaction Models | Regression models that test whether the effect of one variable (PM₂.₅) changes depending on another (SDI), revealing effect modification patterns. |
| Quantile Regression | A statistical technique estimating relationships at different points of the outcome distribution (25th, 75th percentile), useful for understanding heterogeneous effects. |
Ready to Explore the Data?
Now that you understand our methodology, try our interactive tool to see how these findings apply to specific countries.
Launch Data Tool